






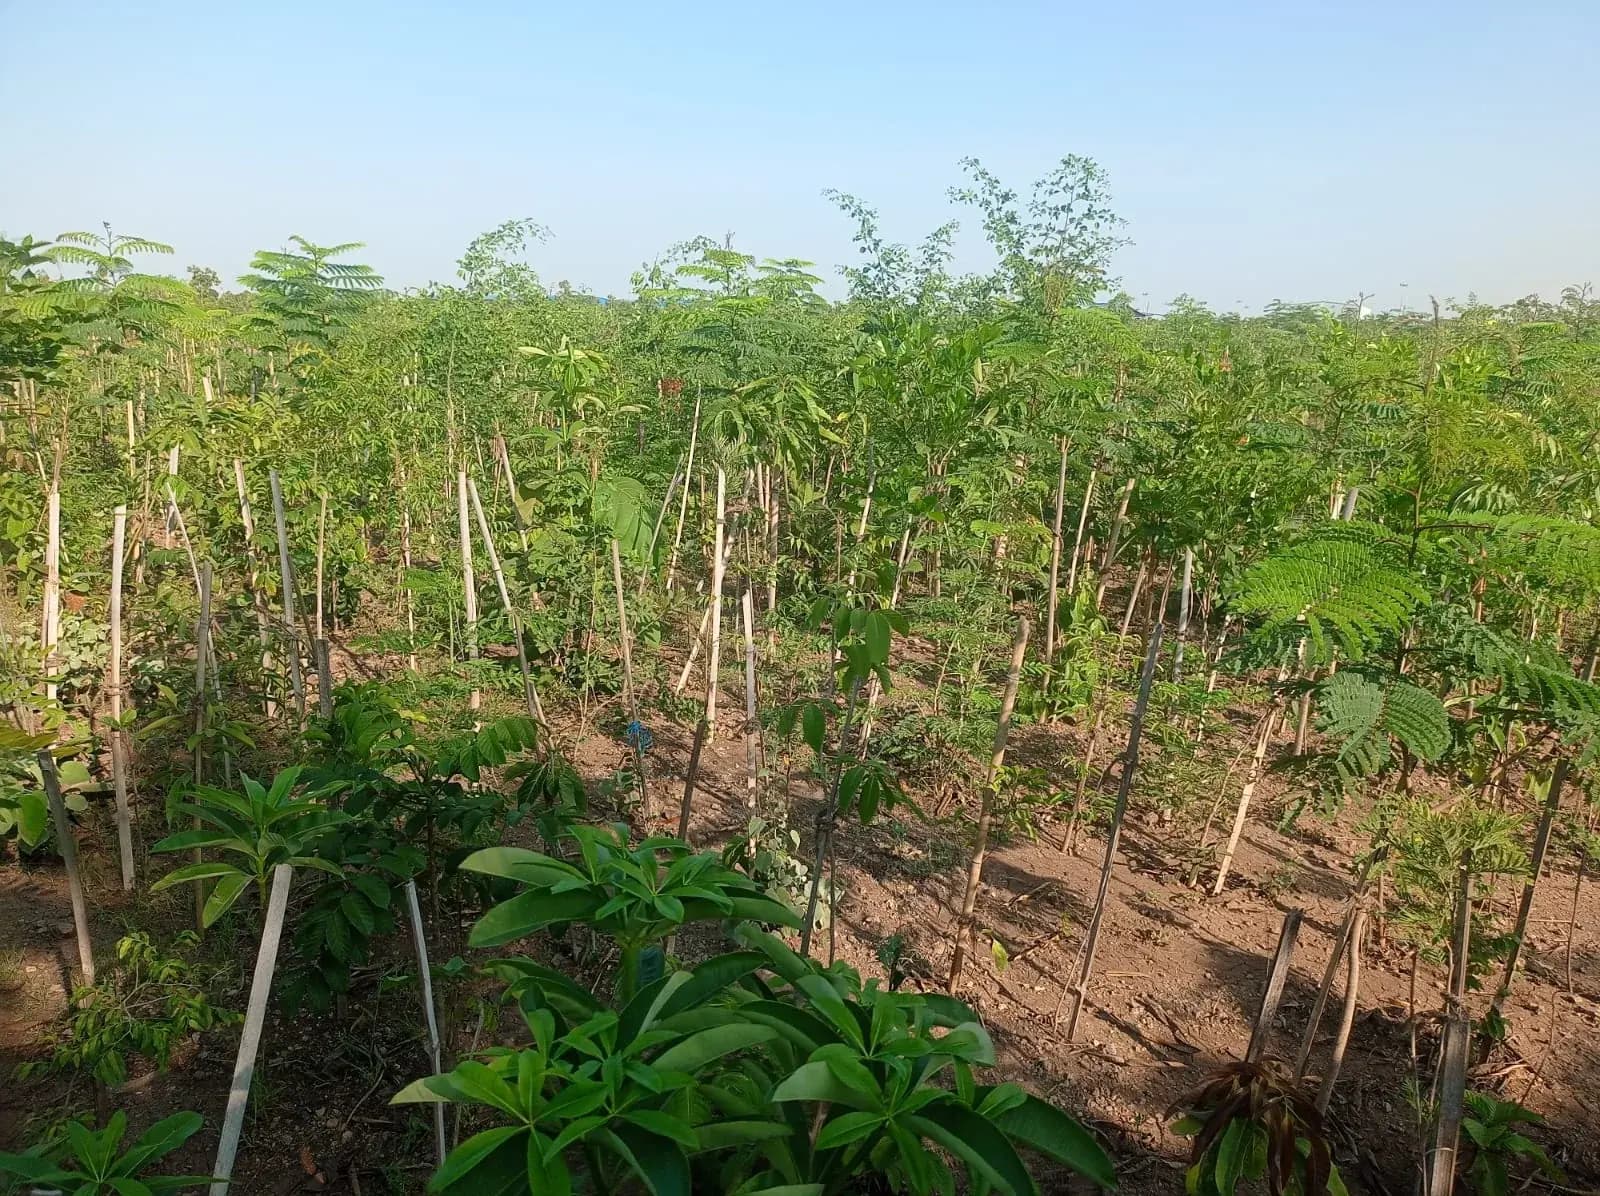
Plantation Survival and Performance Data: the record that decides whether a forest was delivered.
A plantation is not delivered at handover. It is delivered three monsoons later, still alive. And the only thing that can establish which happened is a survival record kept from the day it was planted.
What is measured
Survival, canopy closure, height and girth, species retention, mortality cause
Over what period
From planting through at least three monsoons; longer where the site is retained
Overview
Plantation Survival & Performance Data
Most plantation contracts close on a count: so many saplings, planted, signed for. The count says nothing about whether the planting survived its second summer, whether the canopy closed, or whether the species mix held. Those are the questions a city, a corporate estate or a fund actually needs answered, and they can only be answered by returning to the same site, on a fixed schedule, with the same parameters.
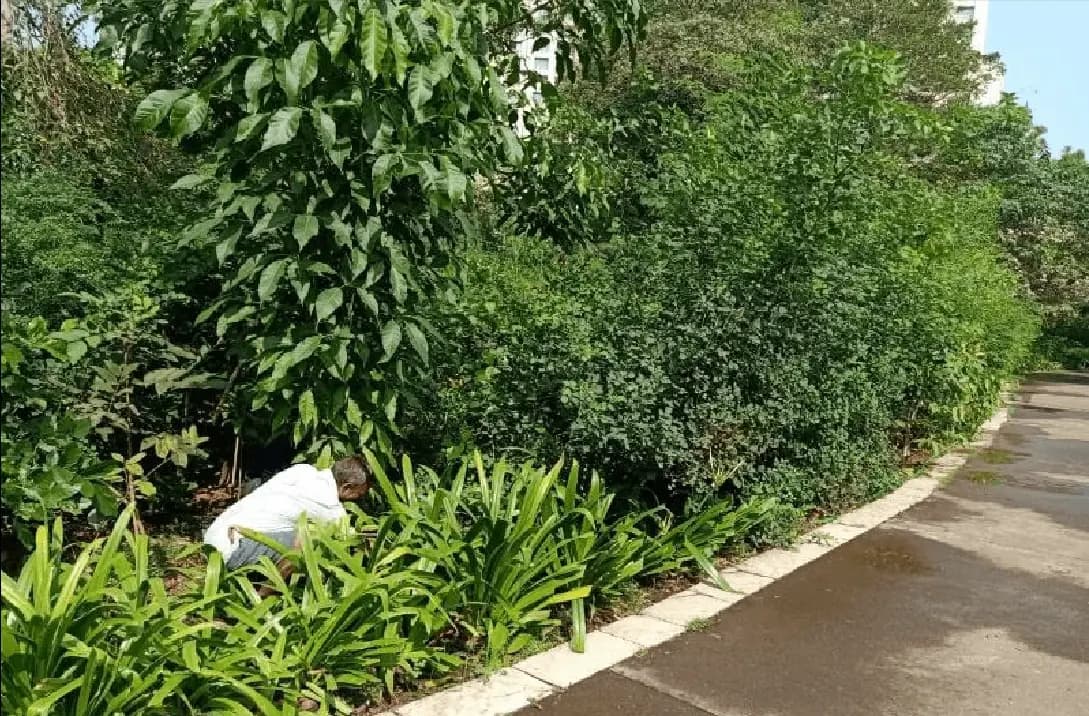
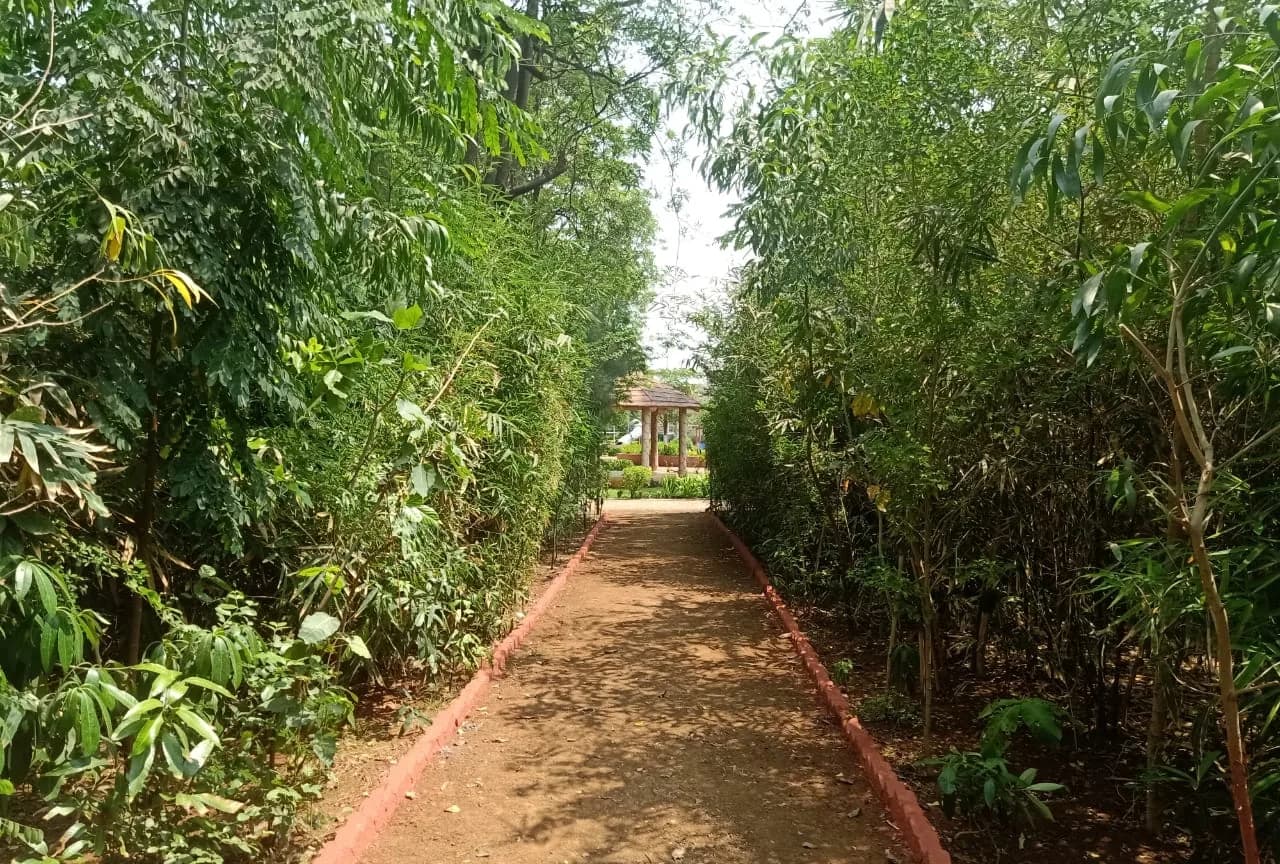
KIPL keeps that record on its own delivered sites, which is the only reason the figures can be defended. Survival is counted plot by plot rather than estimated across the whole area; canopy closure, height and girth are tracked per round; mortality is logged with a cause where one can be established, and replacements are recorded as replacements rather than folded into the original count. The dataset is the wing's longest-running series, and it is what a 95% survival figure means here.
What you get
The deliverables, in hand.
Every item below is a document, dataset or register that is handed over, not a stage in a process.
Baseline planting record: species, numbers, spacing, plot layout and date
Round-by-round survival count, plot-wise rather than area-averaged
Canopy closure, height and girth progression per monitoring round
Mortality log with cause where determinable, and replacement register kept separate
Fixed-point photographic series, so rounds are visually comparable
Survival curve and performance summary suitable for a board or compliance submission
Evidence
Measured, not asserted.
95%
Measured survival across KIPL plantations
1,10,000+
Native trees planted and recorded
2–3 yrs
To canopy closure and self-sustaining stand
Method
Fixed before the first reading.
The method is agreed in advance so that the finding cannot be shaped once the results appear.
Fix the baseline
Species, numbers, spacing and plot boundaries are recorded at planting, with fixed photo points established before the first monsoon.
Return on schedule
The same plots are counted on a fixed calendar rather than when convenient, so the series is comparable across rounds and across sites.
Log the failures
Mortality is recorded with its cause where one is establishable, and replacement planting is tracked separately so survival is never inflated by refills.
Publish the curve
Survival, canopy and growth are reported as a series with its method stated, which is what makes the number auditable rather than quotable.


Geographic scope
Commissioned across twelve markets.
This work is method rather than licence, so it is not bound to the states the delivery practices are accredited in.
- India
- Maldives
- United Arab Emirates
- Saudi Arabia
- Qatar
- Bahrain
- Kenya
- Nigeria
- Singapore
- Bangladesh
- Sri Lanka
- United Kingdom
Commissioned by




























































In the press
Covered where the sector reads.
Straight answers
What clients ask this practice first.
01What does a 95% survival figure actually mean?
It means that at the monitoring round stated, 95% of the saplings originally planted in the counted plots were alive: with replacements excluded from the numerator, because counting refills as survivors is how survival figures get inflated. The figure is only meaningful alongside the round it was measured at and the method used, which is why both are published with it.
02Why count plot by plot instead of across the whole site?
Because an area average hides exactly what matters. A site can average well while one block has failed completely: usually the block with the worst soil, the least irrigation or the most disturbance. Plot-wise counting localises the failure, which is the difference between a number for a report and a number you can act on.
03How long does monitoring need to run?
Through at least three monsoons. Mortality in dense native planting is concentrated in the first two summers, and a stand that has closed canopy and survived three years generally needs no further maintenance. Stopping at one year measures the planting contractor; stopping at three measures the forest.
04Can you monitor a plantation someone else planted?
Yes, and it is a common commission, typically where an owner has inherited a plantation obligation and has no record of what was planted or what survived. The baseline then has to be reconstructed from what is on the ground and whatever planting records exist, and the limits of that reconstruction are stated rather than papered over.
05How is this different from a compliance report?
A compliance report answers a condition for a period. This is a dataset: the same parameters, on the same plots, across years, built so that the trend is readable and the method is reproducible. A compliance report can be produced from it, but the reverse is not true.
06Who uses this data beyond the project that produced it?
Cities and municipal corporations planning plantation programmes, corporate estates with green-cover commitments to report, funds carrying out environmental diligence, and researchers working on urban forestry survival. That reuse is the point of keeping it as a dataset rather than a set of site reports.
Next
Plantation Survival & Performance Data, scoped to your question.
Commissioned work, monitoring frameworks and dataset licensing are scoped directly with the research wing. Tell us the question and we will tell you what it would take to answer it defensibly.